Monitoring your tech (like your dedicated server, wireless access point, desktop, switch, etc.) is important. It can help you find bottlenecks or give you advanced notice a critical piece of hardware is going bad, or even just help you keep track of data points and you can enjoy historical graphs of your systems. As a hosting provider, monitoring is incredibly important for us. We monitor our backend systems, hosting servers, VPS host nodes, and network so we can identify issues before they occur. We’re also fans of two things, in no particular order: open source and simplicity. So our favorite monitoring system is LibreNMS. While there are other open source solutions, we’ve been slowly moving away because we wanted a monitoring system that did one thing, and that one thing really good. We’ve used many monitoring systems over the years and lately, we’ve found that LibreNMS is the best one for our use case.
We put together this guide so that more people are aware of the value of monitoring their systems and to walk you through properly installing LibreNMS. This guide is also based on the LibreNMS installation guide for CentOS 8 with some tweaks and fixes.
About LibreNMS and Why Use It
LibreNMS was forked from Observium in 2013. The reason why they forked was because they had different priorities and ideas from the Observium team. Around the same time, Observium also had a license change and split into a free community edition and a paid commercial edition. So LibreNMS was forked from the last GPL version of Observium.
LibreNMS is licensed under the GNU GPLv3 so it is fully open source. It’s also one of the most feature-rich monitoring solutions that I have found and why I like it so much. Compared to other solutions like Nagios or Zabbix, LibreNMS is really simple to get up and running.
Where to host LibreNMS
You’ll need a system to run LibreNMS from. You can use a VPS for this task or even Docker. However, we’re more hands on so I will be showing you on an AlmaLinux 8 system. You can also use Ubuntu, Debian, CentOS Stream, etc. but this guide won’t have those commands. Also, make sure you have enough RAM, CPU, and disk space. LibreNMS isn’t too resource intensive, but don’t expect to monitor an entire enterprise off of a 2 vCPU, 2 GB VPS. And because you’re logging data, you need somewhere to store that data. So I wouldn’t recommend a 10 gig system either unless you’re really only looking to monitor about 3 devices.
Setup AlmaLinux
Either provision an AlmaLinux VPS or install it on a virtual system. This should be a fresh install with nothing else on it. You can install LibreNMS on an existing system, but you may notice performance issues. We do not recommend it.
This guide also assumes you are using the root user for setup. If you’re not, you can either switch to the root user with the command sudo su - or prepend sudo to the start of every command.
Install required packages
You will need some packages so everything will work properly:
dnf -y install epel-release
dnf -y install dnf-utils http://rpms.remirepo.net/enterprise/remi-release-8.rpm
dnf module reset php
dnf module enable php:remi-8.1
dnf install bash-completion cronie fping git httpd ImageMagick mariadb-server mtr net-snmp net-snmp-utils nmap php-fpm php-cli php-common php-curl php-gd php-gmp php-json php-mbstring php-process php-snmp php-xml php-zip php-mysqlnd python3 python3-PyMySQL python3-redis python3-memcached python3-pip python3-systemd rrdtool unzip
Those may take a minute or two to install.
For this installation, we’re using Apache. You can use NGINX and you might even see additional performance. But we’re using Apache because we’re the most comfortable with it and prefer to use it in situations like this. This is one of those personal preference and use your best judgement type of situations.
Create a librenms user
It’s unsafe to run some applications as root and LibreNMS is no exception. Create and configure a librenms user with the following command:
useradd librenms -d /opt/librenms -M -r -s "$(which bash)"Download LibreNMS files
Next on the list is to get the files for LibreNMS. For this, we’ll be using git and we’ll be installing LibreNMS into /opt. This is a standard location for installing software on Linux systems.
cd /opt
git clone https://github.com/librenms/librenms.git
Set the permissions
Now set file permissions so the LibreNMS user you created is able to properly access everything.
chown -R librenms:librenms /opt/librenms
chmod 771 /opt/librenms
setfacl -d -m g::rwx /opt/librenms/rrd /opt/librenms/logs /opt/librenms/bootstrap/cache/ /opt/librenms/storage/
setfacl -R -m g::rwx /opt/librenms/rrd /opt/librenms/logs /opt/librenms/bootstrap/cache/ /opt/librenms/storage/
Install PHP Composer Dependencies
A lot of LibreNMS is built using PHP Composer packages. These packages are not shipped with LibreNMS, so you need to install them. You should not install PHP Composer packages using root so make sure you switch over to the LibreNMS user you created.
su - librenms./scripts/composer_wrapper.php install --no-devexit
If you receive errors here, it can be related to Python or it can also be because you have restricted Internet access as Composer is pulling packages directly from the Internet.
Set PHP Time Zone
For system monitoring, we use UTC. That is because we have systems in different time zones and as a company, everything is coordinated off of Universal Time. However, if you’re going to use this to just monitor your tech in your homelab, definitely use your local timezone. We’re a hosting provider in different time zones around the world, using UTC makes sense for us.
vi /etc/php.iniAnd then find the time zone setting and edit accordingly. For example, Eastern Time is America/New_York. You can find a full list in the PHP manual.
And then ensure the system time zone matches.
timedatectl set-timezone Etc/UTCServer Configuration
The next major part is configuring all the other server components.
MariaDB configuration
Edit the MariaDB configuration file:
vi /etc/my.cnf.d/mariadb-server.cnfAnd then within the [mysqld] section, add the following:
innodb_file_per_table=1lower_case_table_names=0
Now you can enable and start the server. Don’t forget to secure the server as well.
systemctl enable mariadb
systemctl restart mariadb
And now we will create the database and user that will be used to connect to the database.
mysql -u root
And remember to change the password to something secure.
CREATE DATABASE librenms CHARACTER SET utf8mb4 COLLATE utf8mb4_unicode_ci;
CREATE USER 'librenms'@'localhost' IDENTIFIED BY 'password';
GRANT ALL PRIVILEGES ON librenms.* TO 'librenms'@'localhost';
FLUSH PRIVILEGES;
exit
PHP FPM
Next copy and edit the default PHP FPM config file:
cp /etc/php-fpm.d/www.conf /etc/php-fpm.d/librenms.confvi /etc/php-fpm.d/librenms.conf
Find [www] and change it to [librenms] and then find the user and group and change to your librenms user and group. Then also find listen and give it a name that matches what you called the file (in this case, librenms).
listen = /run/php-fpm-librenms.sockAnd if there are no other PHP applications on the server, you can remove the www.conf file. Further tuning can be performed in the librenms.conf file.
Apache Web Server
Create the config file:
vi /etc/httpd/conf.d/librenms.confAdd the following. Remember if you named your listener to something other than what we used above, you will need to update this config file with the same path.
<VirtualHost *:80>DocumentRoot /opt/librenms/html/ServerName librenms.example.comAllowEncodedSlashes NoDecode<Directory "/opt/librenms/html/">Require all grantedAllowOverride AllOptions FollowSymLinks MultiViews</Directory># Enable http authorization headers<IfModule setenvif_module>SetEnvIfNoCase ^Authorization$ "(.+)" HTTP_AUTHORIZATION=$1</IfModule><FilesMatch ".+\.php$">SetHandler "proxy:unix:/run/php-fpm-librenms.sock|fcgi://localhost"</FilesMatch></VirtualHost>
We strongly recommend you use a domain name so that you can use a service like certbot to install and keep a SSL certificate updated. Don’t forget to remove the default Apache virtual host.
rm -f /etc/httpd/conf.d/welcome.confNow you can enable HTTPD and the PHP-FPM services.
systemctl enable --now httpdsystemctl enable --now php-fpm
SELinux
You should have SELinux enabled and running (you do, right?) and so we need to tell SELinux the rules for LibreNMS and it’s applications. So first, we need to install the SELinux policy tool:
dnf install policycoreutils-python-utilsAnd then we will configure the core contexts needed by LibreNMS.
semanage fcontext -a -t httpd_sys_content_t '/opt/librenms/html(/.*)?'semanage fcontext -a -t httpd_sys_rw_content_t '/opt/librenms/(rrd|storage)(/.*)?'semanage fcontext -a -t httpd_log_t "/opt/librenms/logs(/.*)?"semanage fcontext -a -t bin_t 'https://cdn.nodespace.com/opt/librenms/librenms-service.py'restorecon -RFvv /opt/librenmssetsebool -P httpd_can_sendmail=1setsebool -P httpd_execmem 1chcon -t httpd_sys_rw_content_t /opt/librenms/.env
LibreNMS also uses fping which is different from standard ping. Because of this, we need to create a context manually. Create a file called http_fping.tt anywhere but I did this from the root home directory. Add the following to the file:
module http_fping 1.0;require {type httpd_t;class capability net_raw;class rawip_socket { getopt create setopt write read };}#============= httpd_t ==============allow httpd_t self:capability net_raw;allow httpd_t self:rawip_socket { getopt create setopt write read };
Then run these commands (and specify to where http_fping.tt is or switch to where you placed it and then run these commands from there.
checkmodule -M -m -o http_fping.mod http_fping.ttsemodule_package -o http_fping.pp -m http_fping.modsemodule -i http_fping.pp
If you have any other issues, check your SELinux log file. You can use this command:
audit2why < /var/log/audit/audit.logOther small things to do
Open ports in your firewall
Just like you should be running SELinux, you should also be running a firewall 😉
firewall-cmd --zone public --add-service http --add-service httpsfirewall-cmd --permanent --zone public --add-service http --add-service https
Enable lnms command completion
This feature grants you the opportunity to use tab for completion on lnms commands as you would for normal linux commands.
ln -s /opt/librenms/lnms /usr/bin/lnms
cp /opt/librenms/misc/lnms-completion.bash /etc/bash_completion.d/
Configure SNMPD
LibreNMS primarily uses SNMP to monitor devices. To monitor the local server, you can use the following:
cp /opt/librenms/snmpd.conf.example /etc/snmp/snmpd.confvi /etc/snmp/snmpd.conf
Edit the text which says RANDOMSTRINGGOESHERE and set your own community string.
curl -o /usr/bin/distro https://raw.githubusercontent.com/librenms/librenms-agent/master/snmp/distro
chmod +x /usr/bin/distro
systemctl enable snmpd
systemctl restart snmpd
SNMP will need to be installed and configured on each system you’re going to monitor. Use SNMP v3 where possible. Treat your SNMP v2 community strings like passwords and only allow read only access! SNMP v1 might only be available on really old devices. You should absolutely avoid using SNMP v1, especially over the internet. If you cannot, a TINC VPN tunnel might be best. Or a SNMP proxy. And utilize rich firewall rules.
Configure the LibreNMS cron
LibreNMS has tasks that need to be a schedule and this is done through cronjobs. Run the following to install the default crons:
cp /opt/librenms/librenms.nonroot.cron /etc/cron.d/librenms
Configure Log Rotate
Log rotate will rotate log files to prevent them from becoming too large. Especially needed on systems like this that can generate a lot of logs!
cp /opt/librenms/misc/librenms.logrotate /etc/logrotate.d/librenms
Install LibreNMS from the Web Interface
Now it’s finally time to start installing LibreNMS! If you have connected your domain, go to http://<yourlibrenmsdomain>/install (and if you didn’t, you can put in your server’s IP address instead) and run through the installer. Because of the file permissions, you may need to copy the generated configuration file to your server.
Start monitoring devices
Now that you have LibreNMS installed, it’s time to start monitoring things! If you’re monitoring things on your local network, you just need to make sure UDP 161 is permitted. For network devices such as switches and routers, you may have a SNMP setting already available you just need to tweak.
For example, here’s how to monitor a pfSense firewall:
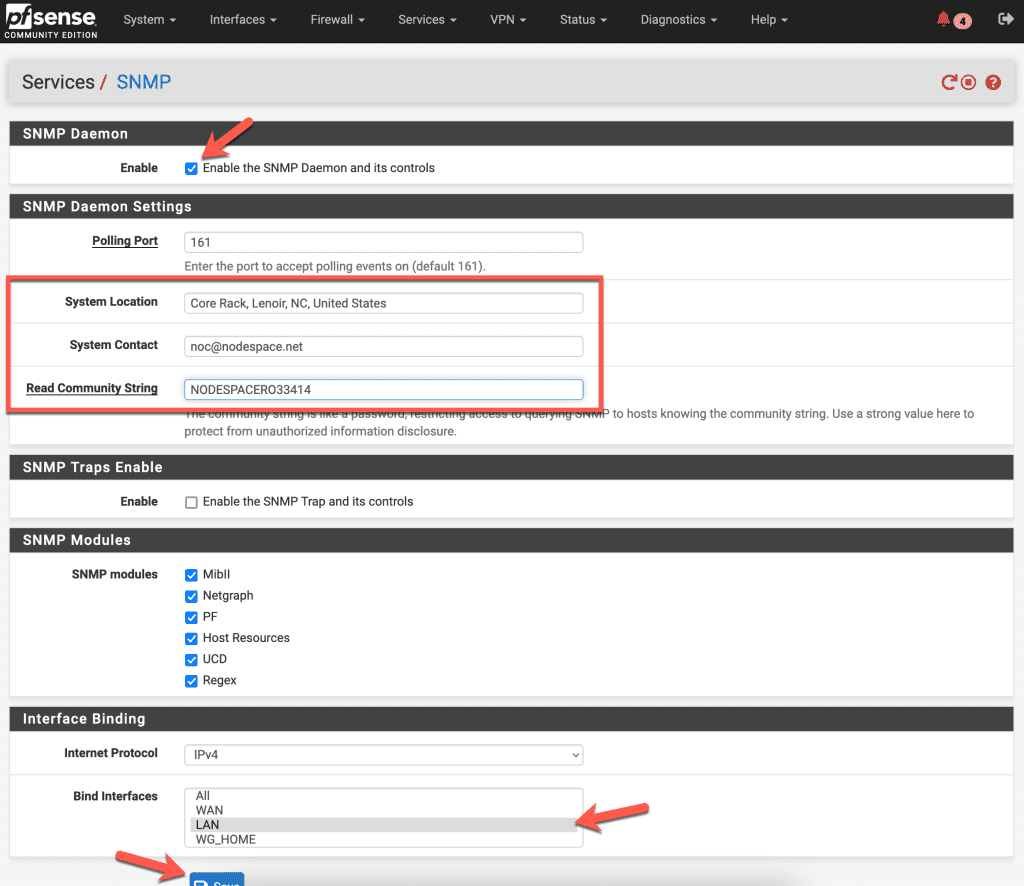
Go to Services > SNMP. Enable the daemon and then go to the settings. By default, it will accept polling events on port 161. You can change that here if needed. Then, you can set the system location, a system contact, and then the read only community string. The community string in this screenshot is an example and it is also not the most secure.
We’ve enabled all the modules to make available over SNMP.
Finally, we’re binding this to the LAN interface. That’s because our LibreNMS server has a secure way to access the interface and we can control SNMP traffic via firewall rules instead of opening it up to all interfaces. So if you have a pfSense firewall at home, bind it to where your LibreNMS server can access it.
Many systems and devices have SNMP support built-in or you may need to enable it. Some Linux distros ship without SNMP packages so you would need to install it and configure it.
LibreNMS also supports a lot of integrations. Some of these do require modifying the systems SNMP config or using a check_mk agent. Full details are available in the LibreNMS docs.
Once your device or devices have SNMP configured, it’s time to add them!
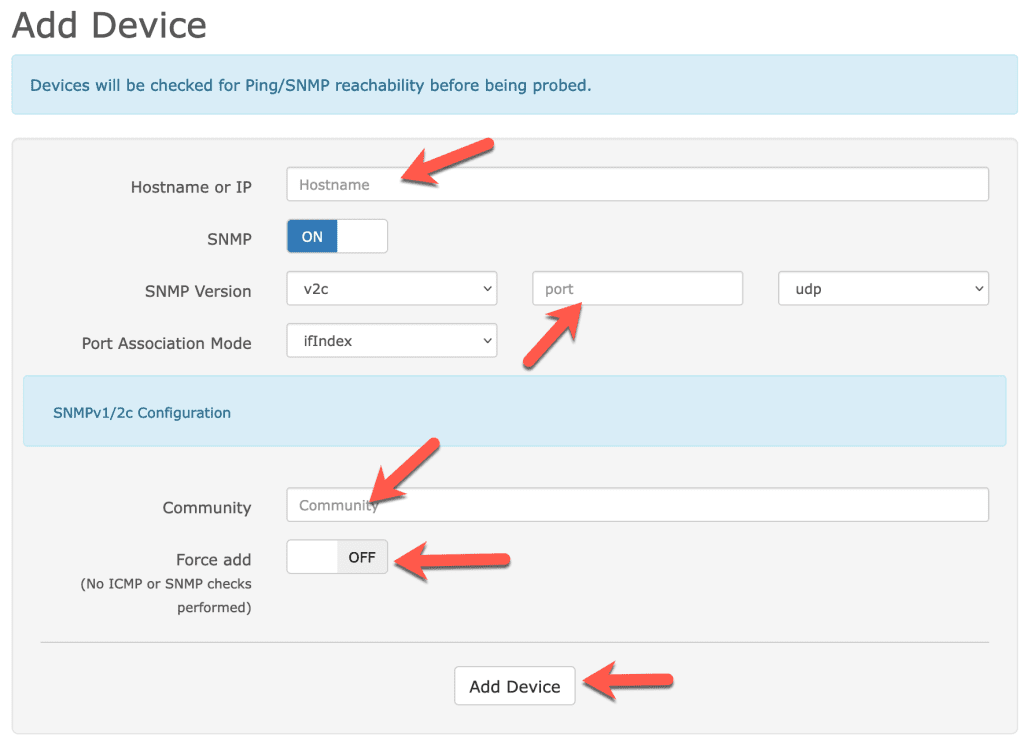
Login to your LibreNMS server and then go to Devices > Add Device.
Enter the hostname (or if it’s only available via IP, the IP address), and then if you’re using anything other than SNMP v2c, or you changed the port, adjust the SNMP settings. Then under the configuration, add your community string. Only turn on the force add option if SNMP is blocked or you will be using the check_mk agent. You may receive an error when attempting to add a device and LibreNMS cannot ping it.
Once added, you should receive a success message. At this point, it’s important to be patient! It takes time for LibreNMS to pull in all the data. If you immediately view the device, you’ll see broken images, missing data, etc. Give it at least 10 to 15 minutes! Once you do that, go to Devices > All Devices and you should see a third level menu with the category of device you added. pfSense will show up as a Firewall. OPNSense will show up as FreeBSD, but also under the firewall category. Most of the time, the classification is correct, however, there are times where it can be wrong. You can edit the device to change it’s classification.
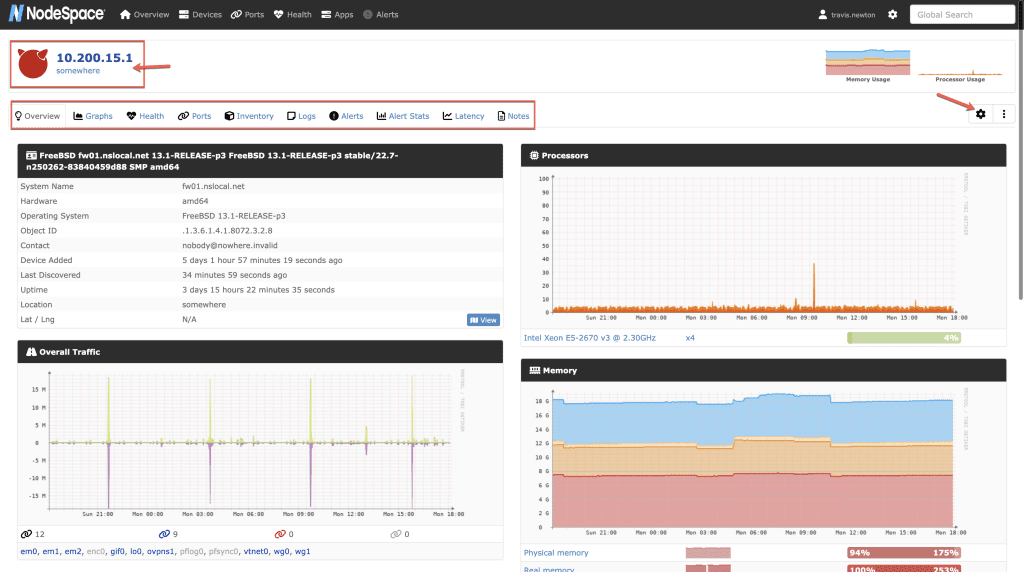
For example, here’s what a OPNSense firewall looks like. This is actually one of our back-end system firewalls. I wanted to show you this because it generates a lot of graph data so it’s far more interesting to look at 🙂
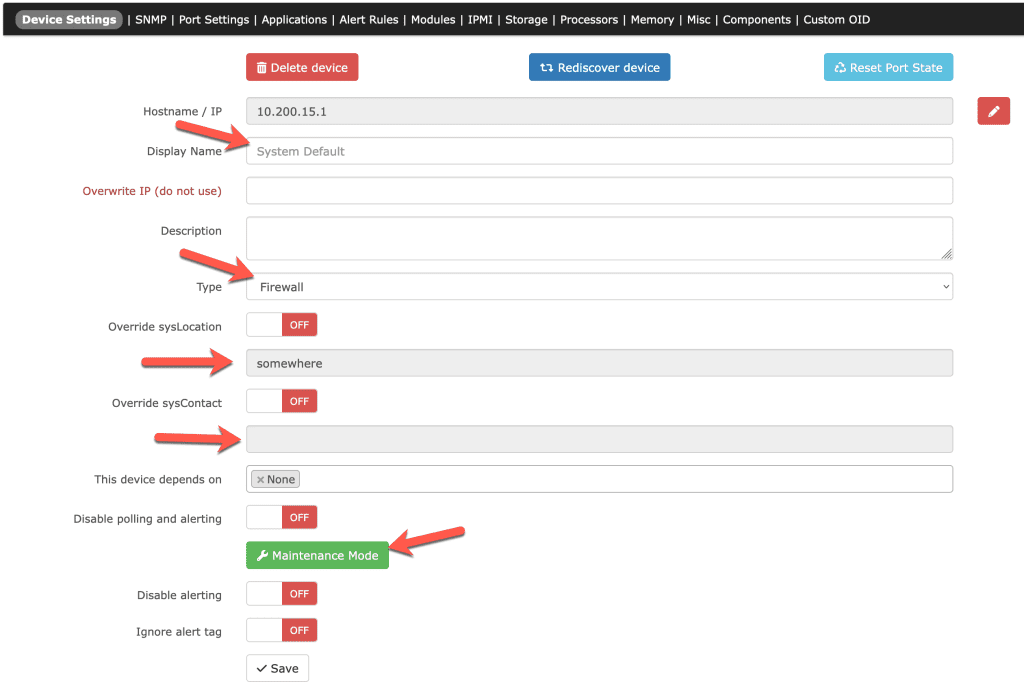
At the top, you can see that it shows the system IP address and the location information (taken from SNMP). You can also see that there are tabs that let us see the device overview, graphs, health, ports, etc. and on the same line there is a gear icon. Clicking that gear lets us modify the device. Let’s say that someone else has admin access to this firewall, but they decided to not change the SNMP location or contact info. If we click on the gear, we can override the information given to us by SNMP.
You can see that if we wanted to, we can override a lot of information. Like the name, description, type, location, and contact. We can also put this device into maintenance mode if we are going to be working on it and don’t want alerts generated. Alternatively, we can also disable alerts or add an ignore tag.
At the top, you’ll notice other options like port settings, applications, alert rules, etc. This is how you can custom-tune this device for monitoring. Get the alerts you want, monitor additional services, etc.
Reading graphs
LibreNMS generates graphs so you can view data. As an example, I’m going to show you a port from one of our TOR (Top of Rack) switches from one of our data center racks. Most of you will use it for monitoring network devices, which makes this a great example.
By default, you will see details in 4 graphs. They’re not clearly labeled not all monitoring systems display data this way. But let’s look at this one particular switchport.
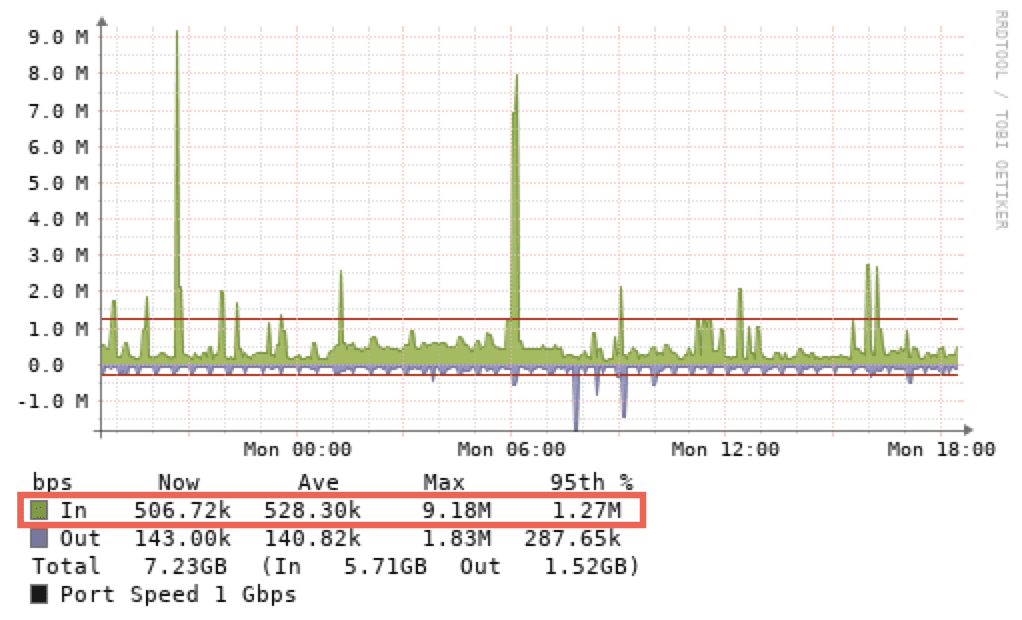
You see the 4 graphs and they are laid out as: 1 day, 1 week, 1 month, 1 year. Daily graphs are always the most detailed and contain a rolling view of the last 24 hours. By rolling, I mean that it doesn’t start at midnight, but rather 24 hours ago – so if you’re viewing a graph at 1:34 PM, you’ll see data from 1:34 PM yesterday to 1:34 PM today since that is 24 hours. To see data from 10 AM, you would need to adjust your view.
When it comes to bandwidth graphs, these are always shown from the switchport’s point of view.
Let’s use the daily graph as an example. You can see that “In” has peaked at 9.18 Mbps. That means that the server connected to this switchport transferred out data at 9.18 Mbps. “Out” data means that the server connected received data at 1.83 Mbps max. “95th %” means 95th percentile. Like other providers, this is how we calculate bandwidth usage. Maybe we’ll do a blog post on that in the future 🙂 But for those who don’t want to wait, it means that 95% of your usage falls below this mark and 5% of your usage is above this. With this method of billing, it means that we disregard the top 5% of usage.
So if you have a dedicated server hosted at another provider and you want to check their usage against your usage, this is a good way to check (just remember, you may have to flip your server numbers to match theirs – they are typically viewing things from the switch and not all providers flip the numbers – in is out and out is in!).
Conclusion
As you start monitoring more, you’ll notice how powerful LibreNMS is. You’ll start to monitor everything with it. Remember, monitoring requires tuning. You cannot just turn on monitoring and forget it. You’ll find false positives and other issues you weren’t aware of. Monitoring also helps you find things wrong with your systems or even uncover problems you didn’t even know existed. Like maybe you can’t figure out why you’re getting a bandwidth overage on your home internet connection. LibreNMS might uncover that a system is suddenly downloading 20 GB in the middle of the night because of a failed backup job.
It also helps you improve your security posture. You can know when things occur on systems and even note any changes you weren’t expecting.
